What’s happening?
In the traditional on-premises world, if you or your IT department can figure out how to monitor Planning (and Essbase and FR and FDMEE and who knows what else), the world is your oyster at least when it comes to server and application statistics. Tracking Planning itself is, at best, an art and I’ve never seen anyone convincingly capture its statistics. It’s hard.
At least in the on-premises world we can get our figurative fingers around the servers. In the Brave New World of SaaS that simply isn’t possible. In fact there is no access to server(s) behind PBCS. And that’s not by accident but in fact is the whole point behind SaaS. No muss, no fuss, just Planning in the cloud. Seriously, is there anyone out there that likes owning Hyperion infrastructure except consulting companies with rapidly-declining infrastructure practices? No, thought not.
No Essbase or Planning web application logs, no IP reports, no nothing. How on earth do we geeks know what’s going on within our PBCS application? Remember, this isn’t like on-premises Planning where you can look at servers while running Planning, looking at log files, or calling up and abusing your woefully overworked BOFH because things have gone FOOM!
So what what happens when your BOFH or even you, oh Gentle Reader, wants to know what on earth is going on in within your PBCS app? Is it sclerotic in nature? Was it formerly Zip-a-Dee-Doo-Dah fast before but now is like molasses on a cold New England morn? Would you just like to know who, what, when, where, and how your system is being used? You are in luck for PBCS now has an activity report that will give you deep insight into your pod. And – cos’ it’s SaaS – the whole thing is there for the asking. No IT, no fancy consultants, no nothing. Or is that something? You decide.
Steps to performance Nirvana
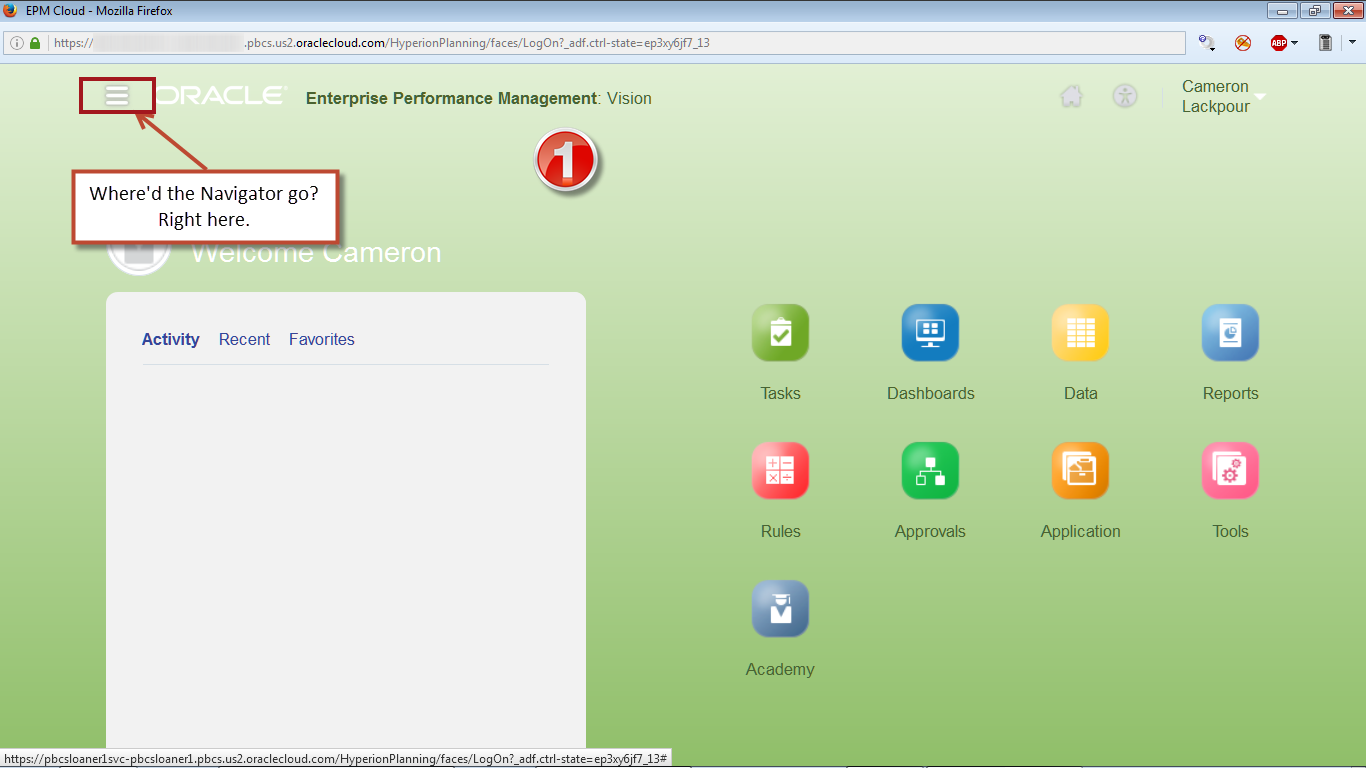
Who moved my Navigator?
Yes, the Cloud is ever changing. Sometimes that’s a good thing, other times not so much. I hadn’t logged into this instance in over a month and my beloved Navigator was nowhere to be seen. After the mild panic attack, here it is and it’s the first step in getting to that activity report.
Look over it all with Overview
As noted above, everything changes if you haven’t looked at PBCS for a while. Continue on, brave geek, and go to Overview to see the magic. Honestly, it is really cool.

Check out the Activity
We’re getting really close. The most recent day’s activity is available as is data going back 60 days.

And what happens when a date is clicked on? Magic, that’s what.
Let’s look at what we get
What we get is a window into PBCS’ soul. Fair enough, that may be a bit of an exaggeration but if you think about all of the metrics that can be captured in an on-premises system and all of the metrics that cannot be captured in a SaaS offering (which is, um, everything), the fact that PBCS offers this up is really kind of gratifying. Remember, this isn’t idle curiosity but instead how we Planning geeks understand what works and what does not work in our implementation.
I’ll put my comments into the grey boxes. I’m pretty sure Oracle doesn’t supply running commentary on the report but if you ask really nicely, perhaps they will.
Activity Report
All Times in Pacific Standard Time
Number of Users
This is more than just the number of users – it’s the users over the last five days, how long they used it per day, how many users there have been over the last 7 and even 30 days. Wowzers.
Metric
|
09/16
|
09/17
|
09/18
|
09/19
|
09/20
|
09/21
|
Today
|
Users
|
267
|
257
|
34
|
72
|
333
|
348
|
396
|
Usage Duration in Hours
|
121
|
124
|
44
|
58
|
159
|
186
|
248
|
Users Last 7 Days
|
478
|
479
|
466
|
483
|
574
|
608
|
653
|
Users Last 30 Days
|
865
|
861
|
808
|
776
|
825
|
868
|
890
|
Do you think the application is slow? Or are you just (like me) incredibly impatient? Numbers don’t lie and this report tells me if it’s the UI or calcs provide the most pain. As one might imagine, it’s the calcs and they’re detailed by user, location, time of day, form (or Smart View), and time. Must Write Better Code.
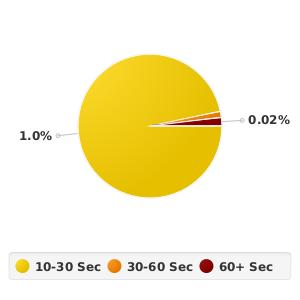
Percentage of UI Requests over 10 Seconds (1.03%)
Top 30 Worst Performing User Interface Actions over 10 Seconds
Duration (Min:Sec)
|
User
|
Time
|
Screen
|
Action
|
Object
|
Durations (Min:Sec)
| |
373:34
|
xx250059
|
20:52:49
|
Smart View
|
Adhoc Get Default Grid
|
Essbase=373:33
| ||
216:46
|
xx250460
|
18:32:37
|
Smart View
|
Adhoc Get Default Grid
|
Essbase=216:45
| ||
188:58
|
xx250253
|
18:38:45
|
Smart View
|
Adhoc Get Default Grid
|
Essbase=187:52
| ||
188:32
|
xx185095
|
19:59:32
|
Planning
|
SmartView
| |||
185:24
|
xx200008
|
05:43:39
|
Planning
|
SmartView
| |||
184:21
|
xx185020
|
16:05:31
|
Smart View
|
Adhoc Get Default Grid
|
Essbase=184:20
| ||
174:14
|
xx250036
|
15:20:52
|
Smart View
|
Adhoc Get Default Grid
|
Essbase=173:09
| ||
143:15
|
xx250180
|
05:24:46
|
Planning
|
SmartView
| |||
99:17
|
xx129565
|
05:43:39
|
Planning
|
SmartView
| |||
01:25
|
btchadmin
|
16:36:30
|
EPM Automate
|
Download File Zip
|
File Name=EXP_Sec.zip
| ||
00:59
|
xx185067
|
10:03:50
|
Smart View
|
Save Form
|
40.0 Revenue (USD),
|
Essbase=00:01
User Experience=01:08 Client=00:07 Data Validation=00:00 SmartPush=00:00 Business Rules=00:56 Network=00:02 | |
00:45
|
xx185091
|
13:00:02
|
Smart View
|
Save Form
|
40.0 Revenue (USD),
|
Essbase=00:01
User Experience=00:54 Client=00:08 Data Validation=00:00 SmartPush=00:00 Business Rules=00:42 Network=00:01 | |
00:40
|
xx185126
|
12:26:21
|
Smart View
|
Save Form
|
10.A Travel,
|
Essbase=00:01
User Experience=00:46 Client=00:05 Data Validation=00:00 SmartPush=00:00 Business Rules=00:38 Network=00:00 | |
00:38
|
xx185126
|
12:03:19
|
Smart View
|
Save Form
|
10.A Travel,
|
Essbase=00:00
User Experience=00:50 Client=00:10 Data Validation=00:00 SmartPush=00:00 Business Rules=00:36 Network=00:00 | |
00:38
|
xx185126
|
11:42:56
|
Smart View
|
Save Form
|
10.A Travel,
|
Essbase=00:00
User Experience=00:55 Client=00:11 Data Validation=00:00 SmartPush=00:00 Business Rules=00:35 Network=00:06 | |
00:36
|
xx185135
|
13:10:28
|
Application Management
|
User Login Report
|
Access During=120,
| ||
00:32
|
xx185085
|
02:43:53
|
Planning
|
PlanningCentral
| |||
00:31
|
xx185154
|
08:11:51
|
Smart View
|
Save Form
|
10.A Travel,
|
Essbase=00:00
User Experience=01:25 Client=00:52 Data Validation=00:00 SmartPush=00:00 Business Rules=00:28 Network=00:01 | |
00:31
|
xx185099
|
20:19:18
|
Smart View
|
Save Form
|
10.A Travel
|
Essbase=00:01
| |
00:29
|
xx250289
|
10:48:24
|
Smart View
|
Save Form
|
9.D Software (Owned Leased),
|
Essbase=00:00
User Experience=00:52 Client=00:21 Data Validation=00:00 SmartPush=00:00 Business Rules=00:28 Network=00:01 | |
00:28
|
xx185126
|
12:23:13
|
Smart View
|
Save Form
|
10.A Travel,
|
Essbase=00:00
User Experience=00:36 Client=00:07 Data Validation=00:00 SmartPush=00:00 Business Rules=00:27 Network=00:00 | |
00:28
|
xx185126
|
12:06:31
|
Smart View
|
Save Form
|
10.A Travel,
|
Essbase=00:00
User Experience=00:44 Client=00:12 Data Validation=00:00 SmartPush=00:00 Business Rules=00:25 Network=00:04 | |
00:27
|
xx185091
|
12:58:23
|
Smart View
|
Save Form
|
40.0 Revenue (USD),
|
Essbase=00:01
User Experience=00:46 Client=00:17 Data Validation=00:00 SmartPush=00:00 Business Rules=00:24 Network=00:01 | |
00:27
|
xx185154
|
08:24:21
|
Smart View
|
Save Form
|
10.A Travel,
|
Essbase=00:00
User Experience=01:26 Client=00:51 Data Validation=00:00 SmartPush=00:00 Business Rules=00:24 Network=00:07 | |
00:27
|
xx185091
|
04:47:50
|
Smart View
|
Save Form
|
40.0 Revenue (USD),
|
Essbase=00:00
User Experience=00:49 Client=00:14 Data Validation=00:00 SmartPush=00:00 Business Rules=00:25 Network=00:08 | |
00:26
|
xx185013
|
01:34:31
|
Smart View
|
Save Form
|
10.A Travel - Summary,
|
Essbase=00:11
User Experience=03:20 Client=02:49 Data Validation=00:00 SmartPush=00:00 Business Rules=00:05 Network=00:04 | |
00:26
|
xx185013
|
01:19:19
|
Smart View
|
Save Form
|
10.A Travel - Summary,
|
Essbase=00:10
User Experience=03:17 Client=02:50 Data Validation=00:00 SmartPush=00:00 Business Rules=00:04 Network=00:01 | |
00:26
|
xx185091
|
07:48:50
|
Smart View
|
Save Form
|
40.0 Revenue (USD),
|
Essbase=00:01
User Experience=00:55 Client=00:25 Data Validation=00:01 SmartPush=00:00 Business Rules=00:22 Network=00:03 | |
00:26
|
xx185091
|
07:50:55
|
Smart View
|
Save Form
|
40.0 Revenue (USD),
|
Essbase=00:01
User Experience=00:48 Client=00:20 Data Validation=00:00 SmartPush=00:00 Business Rules=00:23 Network=00:02 | |
00:25
|
xx185154
|
08:28:58
|
Smart View
|
Save Form
|
10.A Travel,
|
Essbase=00:00
User Experience=01:13 Client=00:45 Data Validation=00:00 SmartPush=00:00 Business Rules=00:22 Network=00:03 | |
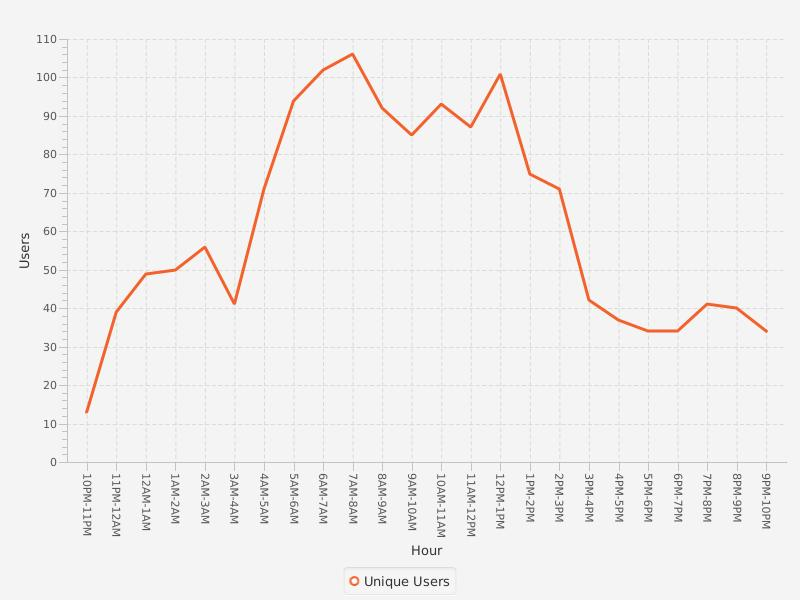
How many Planners use the system? How long do they use it? And when? PBCS tells all.
Users by Hour
Number of Users by Usage Duration

Who uses it the most? Who uses it the least?
Top 10 Most Active Users by Usage Duration
User
|
Usage Duration (Min:Sec)
|
a12345.btchadmin
|
1321:10
|
a12345.xx250110
|
310:03
|
a12345.xx185157
|
289:05
|
a12345.xx185398
|
237:53
|
a12345.xx210023
|
229:28
|
a12345.xx111085
|
223:30
|
a12345.xx185095
|
205:40
|
a12345.xx185265
|
204:48
|
a12345.xx185135
|
203:41
|
a12345.xx250118
|
189:02
|
10 Least Active Users by Usage Duration
User
|
Usage Duration (Min:Sec)
|
a12345.xx185113
|
00:00
|
a12345.xx185082
|
00:00
|
a12345.xx250330
|
00:00
|
a12345.xx185072
|
00:00
|
a12345.xx162800
|
00:01
|
a12345.xx185057
|
00:06
|
a12345.xx185005
|
00:11
|
a12345.xx250243
|
00:16
|
a12345.xx185066
|
00:17
|
a12345.xx250173
|
00:19
|
Browser problems are a fact of life in Planning-land. Think of all of the pain that surrounds IE11 and Enterprise Mode. Ugh. Perhaps you can convince your Planners to go with something a bit less old fashioned. At least you’ll know what they use.
Browser Version Usage
Browser Version
|
Usage Count
|
Microsoft Internet Explorer 11.0
|
3
|
Chrome 53.0.2785.116
|
2
|
Firefox 45.0
|
1
|
Firefox 48.0
|
1
|
Is that enough? It should be.
Inquiring minds want to know
What I’ve illustrated is what’s available today in PBCS. Is that available in out-of-the-box on-premises Planning? Do I really have to ask? No.
Putting aside the smugness that comes with PBCS’ features vis-à-vis on-premises, what else might PBCS provide to us in the way of an activity report? I for one would like to know:
- What, on average, are my longest Business Rules by form? Slow “saves” – we know these are really form calculations – cause users to lose their Planning minds.
- How long are my longest Business Rules, attached to a form or not?
- Perceived performance can come from a slow UI, or a slow calc, or a slow save to Planning. But a bad network connection also makes things slow. That’s not an application fault.
- What’s been changed in the application. You know what you’ve changed, but what about other developers. Actually, if you’re like me, you have no idea what you’ve changed, oh, 15 minutes after you’ve done it. Projects can be crazy…
So what would you like to see when it comes to Planning diagnostics?
Be seeing you.
2 comments:
Hello Cameron,
you asked: So what would you like to see when it comes to Planning diagnostics?
The Problem is, we do not see, but also not control the resources. We can optimize scripts, (or we do not, because we make them work fast with the first release) and maybe a bit on the Dimension layout, but not much more can be done once the gross design has been finalised.
Then, when the PBCS is slow, Oracle will take care of it? Don't they? So what runs today slow will be given more resources and runs tomorrow fast. Isn't that the practice?
Regards.
P.s. We can blame the Internet Performance now. That is all in the cloud.
Hi Cameron,
I have a PBCS question. Early during my implementation, I created a plan type which I now realize I do not need. I would like to either delete that plan type and later create another that I actually need, or rename it to something I actually need. Knowing that PBCS doesn't support the deletion of plan types, what are my options? It has to be possible somehow - I would imagine.
Thank you,
Alain
Post a Comment