Introduction
I don't know about you, but I used to use the Classic Add In's Essbase Query Designer to give me a leg up in writing Essbase Report Scripts. As far as I know, there is no way to do that in Smart View (although I am not a super user of it, so corrections to this sentence please write in care of this blog).
Except of course when there is a way. How? Read on.
Some other blog you probably ought to be reading on a regular basis
I know I do, and you should, too. :)
Check out the Oracle Business Analytics (when did the EPM name go away?) Proactive Support post on How to track MDX queries against Essbase.
There is a new (how new is open to debate, I would say it’s been there all along and is just now getting released to world+dog because it works on my oldish AWS instance from John Booth’s Metavero blog) Essbase.cfg setting that will log Essbase MDX queries.
There is also a Support document on it: Tracking MDX Queries Against an Essbase Database [ID 1543793.1].
The setting is called: TRACE_MDX.
What does it do?
It logs the MDX query and how long that query takes. That’s it you say? Ah, but there is quite a bit of value in this as I will attempt to explain.
The setting
Read the link(s), or know that the Essbase.cfg setting is:TRACE_MDX appname dbname 2
As always with Essbase, make the setting in either Essbase.cfg directly or via EAS (don’t forget to click the Apply button) and then bounce the Essbase service which of course is called anything but Essbase.
Here’s the setting for good old Sample.Basic:
TRACE_MDX Sample Basic 2
NB – On my EPM Windows instance, the Essbase service is called “Oracle Process Manager (EPM_epmsystem1). Intuitive, isn’t it? Umm, no.
Some errata
2 is the loneliest number
Fwiw, I tried 0, 1, 2, and 3 and only 2 seems to make anything get logged. Why the number 2? Why don’t those other values do something? Or is it that I just don't know how to set it? Time will tell.Log location
The results of the MDX queries gets dumped to ARBORPATH\appname\dbname\mdxtrace.log.
Does it actually contain the user name and password of the person/tool doing the pull? Why of course not, that would be too easy. Sigh. You will have to build a cross referencing table. All the more reason Oracle should adopt at least a few ideas from this thread: http://www.network54.com/Forum/58296/thread/1364255484/Collaborate+-+Application+Utilization
Also, you may note that this log file doesn't exactly go into the normal ODL log location. Why?
Just for the record – I’m not sorry that this log exists, I just wish there was a consistent logging architecture. I can barely remember where these things are from version to version; I just wish Oracle would pick a plan and stick with it. Okay, rant over.
How does it work?
Smart View
I *thought* that Smart View used MDX to query Essbase. That may very well be (or maybe not), but ad hoc retrieves against Essbase do not generate any entry in the log. Bummer.
Execute MDX
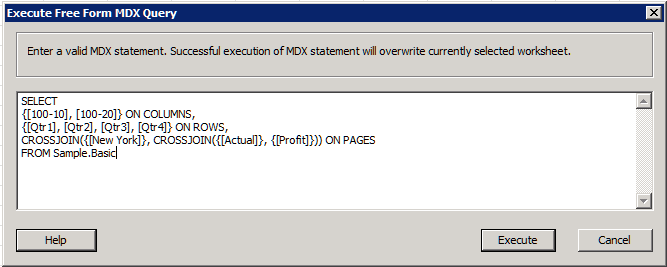
However, you can use Smart View’s “Execute MDX” command and get a value in the log. For those of you not writing MDX on a regular basis (and bear with me, because I think this log is going to drive a lot of people who are not super experienced with MDX towards it in future), you get to that option by right clicking on the Essbase database (ASO or BSO, it doesn’t matter) and selecting “Execute MDX”.
A dialog box pops up, and you can enter your MDX directly (yes, I stole this directly from the Support blog, just wait, I am going to expand on it):
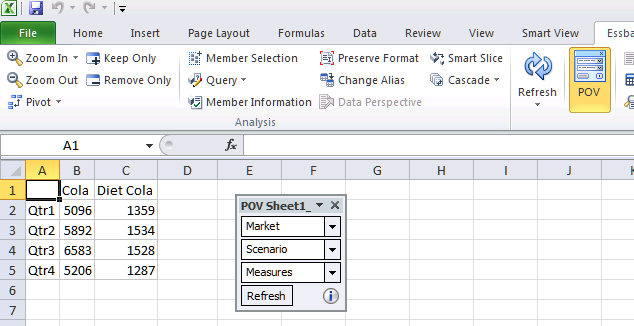
That produces the following result in Excel:
Mdxtrace.log will have the following (the query is in the log):
===============================================================
Following MDX query executed at Mon Apr 08 08:56:13 2013
===============================================================
SELECT
{[100-10], [100-20]} ON COLUMNS,
{[Qtr1], [Qtr2], [Qtr3], [Qtr4]} ON ROWS
FROM Sample.Basic
=== MDX Query Elapsed Time : [0.009] seconds ===================
The corresponding Sample.log file has this:[Sat Apr 13 13:04:24 2013]Local/Sample/Basic/hypadmin@Native Directory/7244/Info(1013091)
Received Command [MdxReport] from user [hypadmin@Native Directory]
[Sat Apr 13 13:04:24 2013]Local/Sample/Basic/hypadmin@Native Directory/7244/Info(1260039)
MaxL DML Execution Elapsed Time : [0] seconds
Pretty cool, eh?
One odd thing
===============================================================
Following MDX query executed at Mon Apr 08 08:56:13 2013
===============================================================
SELECT
{[100-10], [100-20]} ON COLUMNS,
{[Qtr1], [Qtr2], [Qtr3], [Qtr4]} ON ROWS
FROM Sample.Basic
=== MDX Query Elapsed Time : [0.009] seconds ===================
The corresponding Sample.log file has this:[Sat Apr 13 13:04:24 2013]Local/Sample/Basic/hypadmin@Native Directory/7244/Info(1013091)
Received Command [MdxReport] from user [hypadmin@Native Directory]
[Sat Apr 13 13:04:24 2013]Local/Sample/Basic/hypadmin@Native Directory/7244/Info(1260039)
MaxL DML Execution Elapsed Time : [0] seconds
Pretty cool, eh?
One odd thing
I noticed, at least on my release of Smart View (version 11.1.2.2.000 (Build 453)), that the above MDX query cannot show the POV members on the sheet. I can toggle the POV button and have them in the floating palette, but that’s the only way it works. This is different than the 11.1.2.2 behavior with ad hoc queries. Maybe this is in the documentation and I missed it? That would not be the first time I’ve blown by this sort of thing. Corrections please in care of this blog’s comment section.
Just for giggles, I tried fully qualifying the axes with the below MDX (again, forgive my child-like MDX skilz):
But all I got was this:
Note that this is NOT the way the MDX queries in say ,EAS display:
Not a big deal and yes, you could have used axis(0), axis(1), and axis(2) instead of COLUMNS, ROWS, and PAGES.
But wait there’s more in Smart View
Smart Slices
Even though not seeing the MDX from an ad hoc query is kind of a bummer (and again, maybe I am misunderstanding how Smart View queries data from Essbase), did you know that Smart Slices are just MDX queries? And that means that you can view the MDX in mdxtrace.log.
Define the Smart Slice any which way you want.
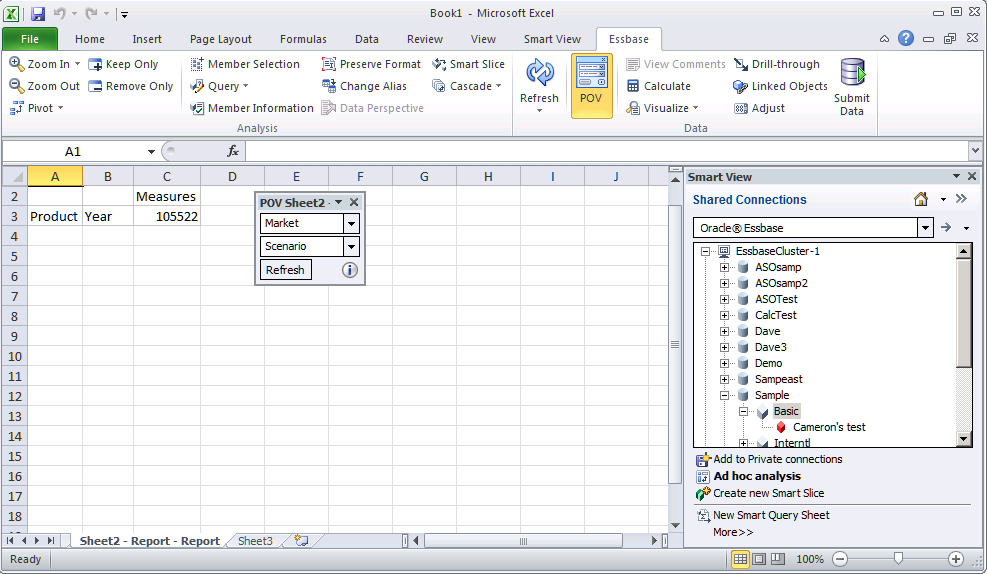
Do an ad hoc query off of the Smart Slice named Cameron’s test:
And, voila:
===============================================================
Following MDX query executed at Sat Apr 13 14:37:10 2013
===============================================================
SELECT
{ CROSSJOIN( { [Product] } , { [Year] } ) } PROPERTIES [MEMBER_ALIAS],[MEMBER_UNIQUE_NAME] ,[GEN_NUMBER],[LEVEL_NUMBER] ON ROWS,
{ { [Measures] } } PROPERTIES [MEMBER_ALIAS],[MEMBER_UNIQUE_NAME],[GEN_NUMBER],[LEVEL_NUMBER] ON COLUMNS WHERE {( [East] , [Budget] )} PROPERTIES [MEMBER_ALIAS],[MEMBER_UNIQUE_NAME]
=== MDX Query Elapsed Time : [0.001] seconds ===================
Now are you getting interested in this?
Did you note how there is no FROM Sample.Basic statement in the MDX above? I have to guess that it is somehow stored in the Smart Slice itself and so it isn’t necessary. Again, smarter minds than mine please chime in via the comments section.
What triggers MDX and just what kind of MDX?
Drilling up and down in the sheet does not generate new MDX queries. However, changing Measures to Profit through the Member Selection dialog box does.
Unsurprisingly, a Member Selection action produces a metadata query (you knew MDX could do that because you’ve been or read Gary Crisci’s Kscope presentation on that, right?):
===============================================================
Following MDX query executed at Sat Apr 13 15:30:39 2013
===============================================================
SELECT {HEAD( DESCENDANTS( [Measures] ),5001 )} PROPERTIES [MEMBER_ALIAS],[MEMBER_UNIQUE_NAME],[SHARED_FLAG] ON COLUMNS
=== MDX Query Elapsed Time : [0.000] seconds ===================
Actually clicking on Refresh produces the following MDX – note Profit is now defined:
===============================================================
Following MDX query executed at Sat Apr 13 15:30:39 2013
===============================================================
SELECT
{ CROSSJOIN( { [Product] } , { [Year] } ) } PROPERTIES [MEMBER_ALIAS],[MEMBER_UNIQUE_NAME] ,[GEN_NUMBER],[LEVEL_NUMBER] ON ROWS,
{ { [Profit] } } PROPERTIES [MEMBER_ALIAS],[MEMBER_UNIQUE_NAME],[GEN_NUMBER],[LEVEL_NUMBER] ON COLUMNS WHERE {( [East] , [Budget] )} PROPERTIES [MEMBER_ALIAS],[MEMBER_UNIQUE_NAME]
=== MDX Query Elapsed Time : [0.000] seconds ===================
Getting back to that metadata query, what does it look like in MaxL (I have to stick it there to try to read what comes out)?. Here’s my super simple MaxL:
login hypadmin password on localhost ;
alter session set dml_output alias off ;
alter session set dml_output numerical_display fixed_decimal ;
alter session set dml_output precision 15 ;
set column_width 80 ;
set timestamp on ;
spool on to "c:\\tempdir\\mdxoutput.log" ;
SELECT {HEAD( DESCENDANTS( [Measures] ),5001 )} PROPERTIES [MEMBER_ALIAS],[MEMBER_UNIQUE_NAME],[SHARED_FLAG] ON COLUMNS
FROM [Sample.Basic] ;
exit ;
And that produces:
===============================================================
Following MDX query executed at Sat Apr 13 15:34:00 2013
===============================================================
SELECT {HEAD( DESCENDANTS( [Measures] ),5001 )} PROPERTIES [MEMBER_ALIAS],[MEMBER_UNIQUE_NAME],[SHARED_FLAG] ON COLUMNS
FROM [Sample.Basic]
=== MDX Query Elapsed Time : [0.001] seconds ===================
And this:
You can pull the file down from here for your amusement and also because the above is just illegible.
I count 17 data values. There happen to be 17 Measures. I think (boy oh boy am I doing a lot of guessing in this blog post) those are internal index values for the Measure dimension members. Once again, pretty cool, eh? Dear Tim Tow, when you tell me things like this about Essbase, I do try to remember them, even though 90% of what you tells me flies over my head.
Query Designer
And of course there is a Query Designer in Smart View. If you guessed that this too was a MDX query, you would be 100% right.
When I click on the Apply Query button:
I get this in Smart View:
And this in mdxtrace.log:
===============================================================
Following MDX query executed at Sat Apr 13 14:41:19 2013
===============================================================
SELECT
{ CROSSJOIN( { [Product] } , { [Year] } ) } PROPERTIES [MEMBER_ALIAS],[MEMBER_UNIQUE_NAME] ,[GEN_NUMBER],[LEVEL_NUMBER] ON ROWS,
{ { [Measures] } } PROPERTIES [MEMBER_ALIAS],[MEMBER_UNIQUE_NAME],[GEN_NUMBER],[LEVEL_NUMBER] ON COLUMNS WHERE {( [East] , [Budget] )} PROPERTIES [MEMBER_ALIAS],[MEMBER_UNIQUE_NAME]
=== MDX Query Elapsed Time : [0.000] seconds ===================
Financial Reports
What, Smart View (mostly) exposed isn’t enough for you? Good grief. Did you know that Financial Reports uses MDX? And this time we can view it all, baby. Duluth, MN? Really? Moving on…and realizing that the DPD will likely arrest me on sight for that comment,...
Let’s take this simple report:
Run it in HTML Preview mode:
And see that it produces:
===============================================================
Following MDX query executed at Sat Apr 13 15:49:05 2013
===============================================================
SELECT
{[Qtr1], [Qtr2], [Qtr3], [Qtr4]}
DIMENSION PROPERTIES [Year].[MEMBER_ALIAS] , [Year].[MEMBER_UNIQUE_NAME]
ON COLUMNS ,
{[Profit], [Margin], [Sales], [COGS]}
DIMENSION PROPERTIES [Measures].[MEMBER_ALIAS] , [Measures].[MEMBER_UNIQUE_NAME]
ON ROWS
FROM [Sample].[Basic]
WHERE ([Product], [East], [Actual])
=== MDX Query Elapsed Time : [0.000] seconds ===================
What about Planning?
I understand that Planning forms are MDX-based. Well, opening a form does not generate an MdxReport event in the Essbase application log – I think this is shades of Smart View ad hoc. (Yeah, I have a very long phone call with Tim in the near future so he can explain, again, how all of this stuff works under the covers. And yes, it behooves me to try this out with Dodeca as well but I’ll make that the subject of another blog post.)
However, ad hoc analysis does trigger a MDX query:
Which produces this:
And that in turn produces this in mdxtrace.log:
===============================================================
Following MDX query executed at Sat Apr 13 16:06:04 2013
===============================================================
SELECT {[Period].[YearTotal]} ON COLUMNS,
NONEMPTYBLOCK {[Account].[IncomeStatement],[Account].[300000],[Account].[310000],[Account].[320000],[Account].[330000],[Account].[340000],[Account].[350000]} ON ROWS
FROM SampTest.Consol
WHERE ([Year].[FY13],[Scenario].[Forecast],[Version].[Working],[Segments].[BAS],[Entity].[E01_0])
=== MDX Query Elapsed Time : [0.000] seconds ===================
Do you see what I see? There it is, that still (I think) undocumented super-cool MDX function NONEMPTYBLOCK. Oooh, I love it when a plan comes together.
The conclusion and the point behind all of this
If you can build it in a Smart View Smart Slice, or in Query Designer, you can interrogate mdxtrace.log to find out how Smart View did it. The same goes for Financial Reports. And, with some limitations, the same is true for Planning.
Why oh why oh why would you care about TRACE_MDX? Two reasons spring to mind.
- You should care because this has GOT to be easiest way there is to figure out how to write good MDX, at least from a query perspective. MDX is not…intuitive. Oh sure, if you know it, it’s easy, but that’s because you already went through the pain. For rest of us, it can be a little scary and painful. This simple Essbase.cfg setting can make that learning curve so much easier. Whoever in EPM product management pushed this one through; I give you my BSO-brain’s thanks.
- Why do these tools sometimes go KABOOM on us? How do they work under the covers? What interesting bits of functionality are they using? TRACE_MDX gives us a window into the way (mostly) EPM tools talk to Essbase. As an example, where did that rather cool undocumented keyword NONEMPTYBLOCK came from? Why it came from examining MDX. I’ll bet there’s more cool stuff that we only need to look for.
I also have to give thanks to Oracle Support for once again coming through with some really cool stuff.
NB – One last point – I don’t do OBIEE but I am willing to bet that this setting came about because of the sometimes ugly MDX that OBIEE generates. Again, people more knowledgeable than I should drop me a line to tell world+dog all about it. In any case, we now all get to benefit from TRACE_MDX.
Be seeing you.
Great post. Smart View retrievals don't return MDX because they switched to using the grid API for retrievals. FR may or may not return MDX depending on settings. You can turn off MDX and hsav eit use report script commands.
ReplyDelete